Category:Bode plots
From Wikimedia Commons, the free media repository
(ar) مخطط بود · (de) Bode-Diagramm · (es) Bode · (fa) نمودار بدی · (fr) Diagramme de Bode · (it) Diagramma di Bode · (nl) Bodediagram · (pl) Charakterystyka Bodego · (ru) ЛАФЧХ · (sv) Bodediagram ·
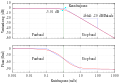
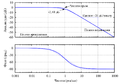
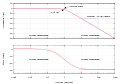
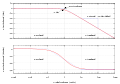
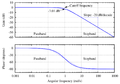
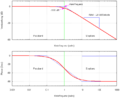
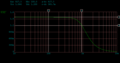
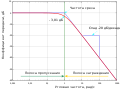
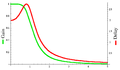
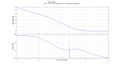
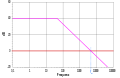
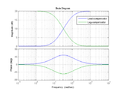
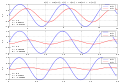
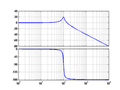
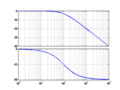
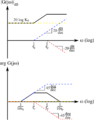
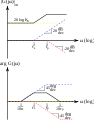
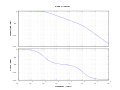
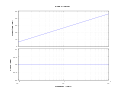
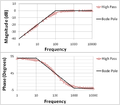
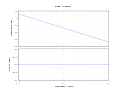
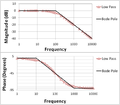
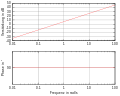
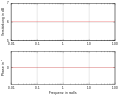
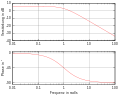
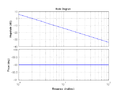
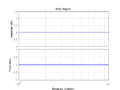
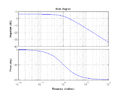
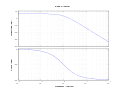
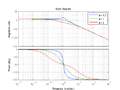
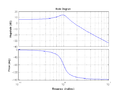
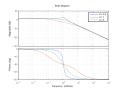
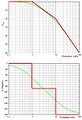
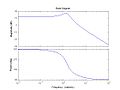
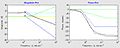
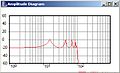
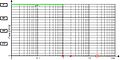
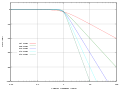
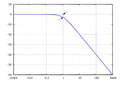
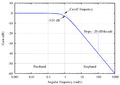
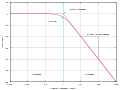
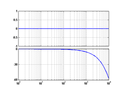
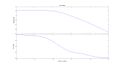
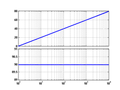
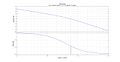
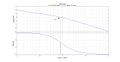
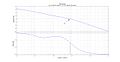
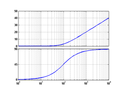
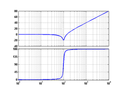
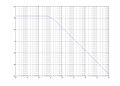
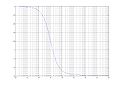
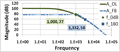
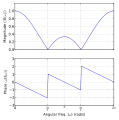
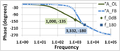
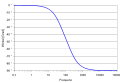
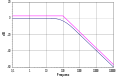
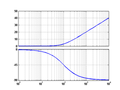
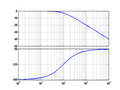
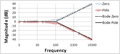
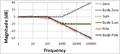
A bode magnitude plot is a graph of log magnitude versus frequency, plotted with a log-frequency axis, to show the transfer function or frequency response of a linear, time-invariant system.
Media in category "Bode plots"
The following 105 files are in this category, out of 105 total.
 Amplituden Phasengang.svg 109 KB
 Aper 2.png 18 KB
 Aper bode.png 14 KB
 Asymptotic Bode plot.png 53 KB
 Asymptotic Bode plot.svg 27 KB
 Bandwidth comparison.JPG 24 KB
 Bode 6.jpg 33 KB
 Bode bsp.png 25 KB
 Bode bsp.svg 187 KB
 Bode d.svg 79 KB
 Bode High-Pass.PNG 67 KB
 Bode i.svg 79 KB
 Bode Low-Pass.PNG 66 KB
 Bode p.svg 72 KB
 Bode plot template.svg 22 KB
 Bode-d.png 8 KB
 Bode-Diagramm-d.svg 20 KB
 Bode-diagramm-p.svg 16 KB
 Bode-diagramm-pt1.svg 19 KB
 Bode-i.png 8 KB
 Bode-p.png 6 KB
 Bode-pt1.png 9 KB
 Bode-PT1.svg 121 KB
 Bode-pt2-var.png 9 KB
 Bode-pt2.png 8 KB
 Bode-PT2.svg 283 KB
 Bode2polesreels.JPG 353 KB
 Bode3.jpg 19 KB
 Bode4.JPG 33 KB
 BodeDiagram.jpg 15 KB
 Bodem03.JPG 323 KB
 Bodem08.JPG 365 KB
 Bodeplot.JPG 18 KB
 Bodeplot.png 725 bytes
 BodePlotEx Im001.jpg 123 KB
 BodePlotEx Im002.jpg 133 KB
 BodePlotEx Im003.jpg 156 KB
 BodePlotEx Im004.jpg 161 KB
 BodePlotEx Im005.jpg 34 KB
 Bodepoledouble.JPG 365 KB
 Butterworth orders.png 93 KB
 Butterworth orders.svg 68 KB
 Butterworth plain.png 58 KB
 Butterworth response.png 86 KB
 Butterworth response.svg 41 KB
 Delay bode.png 13 KB
 DiagramaBode.jpg 48 KB
 Diff bode.png 17 KB
 EjemploLoopShaping1.jpg 102 KB
 EjemploLoopShaping2.jpg 106 KB
 EjemploLoopShaping3.jpg 118 KB
 Filt elect pend.PNG 16 KB
 Filtros electr.PNG 12 KB
 For bode.png 16 KB
 For2 bode.png 18 KB
 FPBajo mod.JPG 232 KB
 FPBajo phas.JPG 237 KB
 FPBanda mod.JPG 236 KB
 FPBanda phas.JPG 236 KB
 FPBP1.png 29 KB
 Gain bode.png 13 KB
 Gain Margin.PNG 39 KB
 HPF NO.jpg 106 KB
 Integ bode.png 16 KB
 LPF NO.jpg 104 KB
 MA2Amp C.svg 63 KB
 Phase Margin.PNG 42 KB
 Scidavis-0.2.3.png 116 KB
 TP100Hz linear.svg 27 KB
 TP100Hz Phase log.svg 88 KB
 TP100Hz-doppel-log.svg 26 KB
 Unstable zero.PNG 14 KB
 Unstaper bode.png 17 KB
 Замкнутая система.png 17 KB
(s%2b3).png/120px-Bode-margin_1_over_s(s%2b2)(s%2b3).png)