File:Alastair Cook test batting career v1.png

Summary[edit]
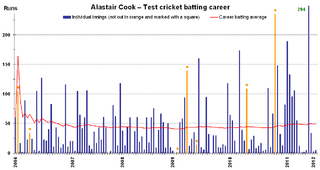
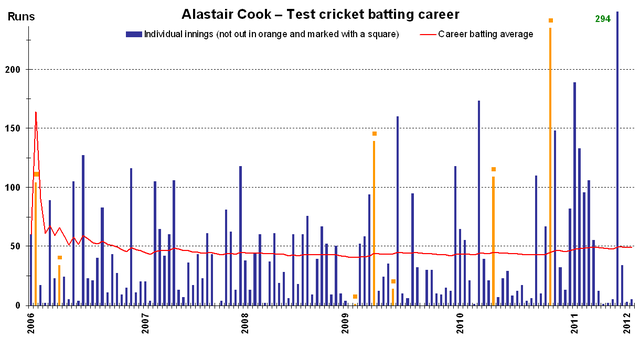
| Description | This graph details the test match performance of cricketer w:Alastair Cook and was created by en.wiki w:user:EdChem. Each bar indicates a single test match innings, blue ones for innings in which he was dismissed, orange ones (marked with a square) for innings in which he batted but was not out. The red line shows his career batting average as at the end of each innings. An alternative version, w::File:Alastair Cook test batting career v2.png instead shows his 10 innings moving average.
The graph was generated with Microsoft Excel 2003, the resulting chart being copied to Adobe Photoshop 9 and saved in .png format, using data from w:Cricinfo [1] and w:Howstat [2]. This version is current as at 24 January 2012, which is also the date it was prepared. This graph details the test match performance of cricketer w:Alastair Cook and was created by en.wiki w:user:EdChem. Each bar indicates a single test match innings, blue ones for innings in which he was dismissed, orange ones (marked with a square) for innings in which he batted but was not out. The red line shows his career batting average as at the end of each innings. An alternative version, w::File:Alastair Cook test batting career v2.png instead shows his 10 innings moving average. The graph was generated with Microsoft Excel 2003, the resulting chart being copied to Adobe Photoshop 9 and saved in .png format, using data from w:Cricinfo [3] and w:Howstat [4]. This version is current as at 24 January 2012, which is also the date it was prepared. |
| Date | |
| Source | Own work |
| Author | EdChem (talk) (Uploads) |
 |
This graph image could be recreated using vector graphics as an SVG file. This has several advantages; see Commons:Media for cleanup for more information. If an SVG form of this image is available, please upload it and afterwards replace this template with {{vector version available|new image name}}. |
Licensing[edit]
|
EdChem at English Wikipedia, the copyright holder of this work, hereby publishes it under the following license:
|
Original upload log[edit]
The original description page was here. All following user names refer to en.wikipedia.
| Date/Time | Dimensions | User | Comment |
|---|---|---|---|
| 2012-01-24 07:38:54 | 1220× 647× | EdChem | This graph details the [[Test Cricket|test match]] performance of cricketer [[Alastair Cook]] and was created by en.wiki [[user:EdChem]]. Each bar indicates a single test match innings, blue ones for innings in which he was dismissed, orange ones (marked |
 |
This media file is uncategorized.
Please help improve this media file by adding it to one or more categories, so it may be associated with related media files (how?), and so that it can be more easily found. Please notify the uploader with
|
File history
Click on a date/time to view the file as it appeared at that time.
| Date/Time | Thumbnail | Dimensions | User | Comment | |
|---|---|---|---|---|---|
| current | 22:52, 24 July 2016 | | 1,220 × 647 (19 KB) | FastilyClone (talk | contribs) | Transferred from en.wikipedia (MTC!) |
- You cannot overwrite this file.
File usage on Commons
The following page links to this file:
File usage on other wikis
The following other wikis use this file:
- Usage on en.wikipedia.org