File:Correlation examples.png
From Wikimedia Commons, the free media repository
Size of this preview: 800 × 336 pixels. Other resolutions: 320 × 134 pixels | 824 × 346 pixels.
Original file (824 × 346 pixels, file size: 15 KB, MIME type: image/png)
| Description |
See below. |
| Date | (original upload date) |
| Source | Transferred from en.wikipedia to Commons by jtneill. |
| Author | Imagecreator at English Wikipedia |
 |
This graph image could be recreated using vector graphics as an SVG file. This has several advantages; see Commons:Media for cleanup for more information. If an SVG form of this image is available, please upload it and afterwards replace this template with {{vector version available|new image name}}. |
Summary[edit]
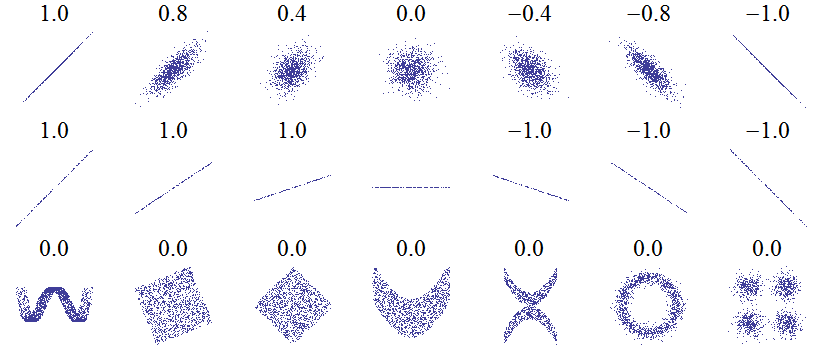
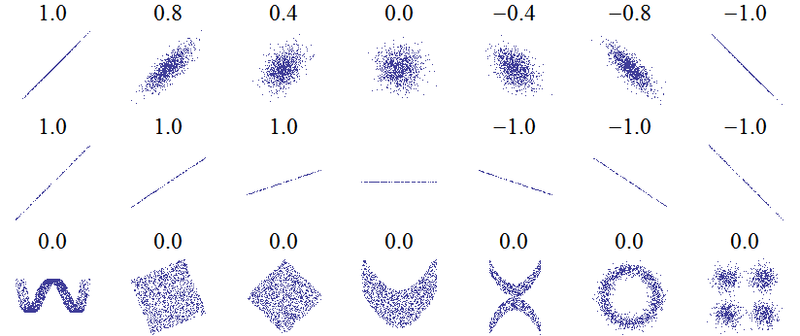
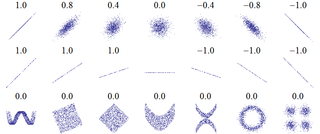
An example of the correlation of x and y for various distributions of (x,y) pairs. It was created by this Mathematica 6 code, which I wrote and release into the public domain (needs makePlot!):
n = 2000;
GraphicsArray[{
  Table[makePlot[
    Table[{RandomReal[NormalDistribution[0, 1]], (1 - Abs[w])*
        RandomReal[NormalDistribution[0, 1]]} .
      RotationMatrix[-Sign[w]*Pi/4], {i, -1, 1, 2./n}], 1000], {w,
    1, -1, -1/3}],
  Table[makePlot[Table[{x, slope*x}, {x, -1, 1, 2./n}], 100], {slope,
    1, -1, -1/3}],
  {
   makePlot[
    Table[{x + RandomReal[]/3,
      4 (x^2 - 1/2)^2 + RandomReal[]/500} , {x, -1, 1, 2./n}], 2000],
   makePlot[
    Table[{RandomReal[{-1, 1}], RandomReal[{-1, 1}]} .
      RotationMatrix[-Pi/8], {x, -1, 1, 2./n}], 1400],
   makePlot[
    Table[{RandomReal[{-1, 1}], RandomReal[{-1, 1}]} .
      RotationMatrix[-Pi/4], {x, -1, 1, 2./n}], 1400],
   makePlot[Table[{x, x^2 + RandomReal[]}/2, {x, -1, 1, 2./n}],
    1400],
   makePlot[
    Table[{x, x^2 + RandomReal[]/2}*(RandomInteger[1]*2 - 1), {x, -1,
      1, 2./n}], 1000],
   makePlot[
    Table[{Sin[x*Pi] + RandomReal[NormalDistribution[0, 1/8]],
      Cos[x*Pi] + RandomReal[NormalDistribution[0, 1/8]]}, {x, -1, 1,
      2./n}], 1400],
   makePlot[
    Table[{RandomReal[NormalDistribution[0, 1/3]],
       RandomReal[
        NormalDistribution[0, 1/3]]} + {RandomInteger[1]*2 - 1,
       RandomInteger[1]*2 - 1}, {x, -1, 1, 2./n}], 1400]
   }
  }]
Licensing[edit]
| This work has been released into the public domain by its author, Imagecreator at English Wikipedia. This applies worldwide. In some countries this may not be legally possible; if so: Imagecreator grants anyone the right to use this work for any purpose, without any conditions, unless such conditions are required by law. |
Original upload log[edit]
The original description page was here. All following user names refer to en.wikipedia.
- 2007-12-08 19:16 Imagecreator 824×346×8 (20371 bytes) == Summary == An example of the correlation of x and y for various distributions of (x,y) pairs. It was created by this Mathematica 6 code, which I wrote and release into the public domain: <pre> (*Several sets of (x,y) points, with the correlation coef
- 2007-12-08 18:48 Imagecreator 824×346×8 (21374 bytes) An example of the correlation of x and y for various distributions of (x,y) pairs. It was created by this Mathematica 6 code, which I wrote and release into the public domain: (*Several sets of (x,y) points, with the correlation coefficient of x \ and y
File history
Click on a date/time to view the file as it appeared at that time.
| Date/Time | Thumbnail | Dimensions | User | Comment | |
|---|---|---|---|---|---|
| current | 09:33, 2 February 2010 | | 824 × 346 (15 KB) | JamesBWatson (talk | contribs) | Removing "0.0" for correlation coefficient from horizontal line: here corr. coeff. is undefined. |
| 10:27, 18 March 2008 | 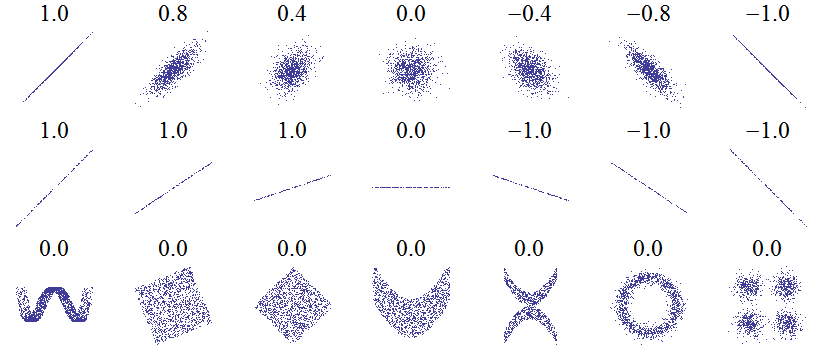 | 824 × 346 (20 KB) | Jtneill (talk | contribs) | {{Information |Description={{en|An example of the correlation of x and y for various distributions of (x,y) pairs. It was created by this Mathematica 6 code, which I wrote and release into the public domain: n = 2000; GraphicsArray[{ Table[makePlot[ |
- You cannot overwrite this file.
File usage on Commons
The following page links to this file:
File usage on other wikis
The following other wikis use this file:
- Usage on ar.wikipedia.org
- Usage on bg.wikipedia.org
- Usage on de.wikipedia.org
- Usage on en.wikipedia.org
- Usage on hi.wikipedia.org
- Usage on it.wikipedia.org
- Usage on lt.wikipedia.org
- Usage on pl.wikipedia.org
- Usage on ru.wikipedia.org
- Usage on th.wikipedia.org
- Usage on tr.wikipedia.org