File:Isotopes and half-life.PNG
From Wikimedia Commons, the free media repository
Size of this preview: 518 × 599 pixels. Other resolutions: 207 × 240 pixels | 415 × 480 pixels | 640 × 740 pixels.
Original file (640 × 740 pixels, file size: 40 KB, MIME type: image/png)
Summary[edit]
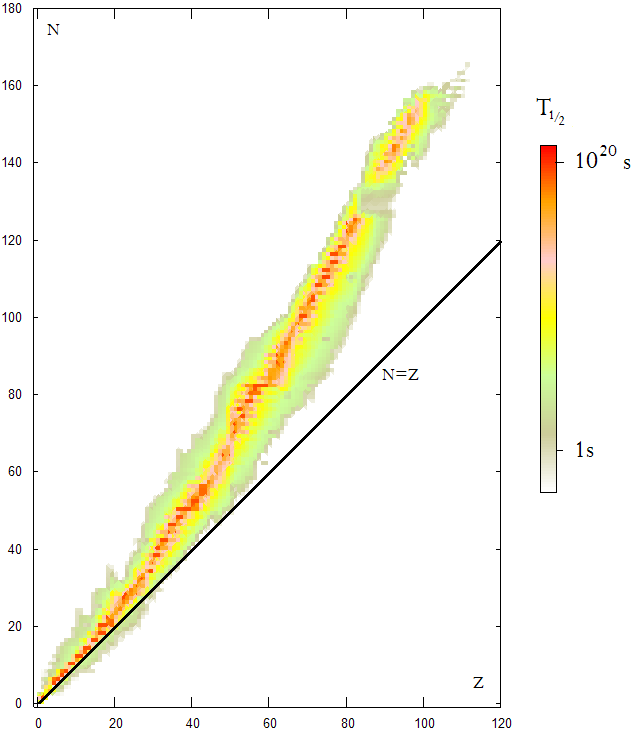
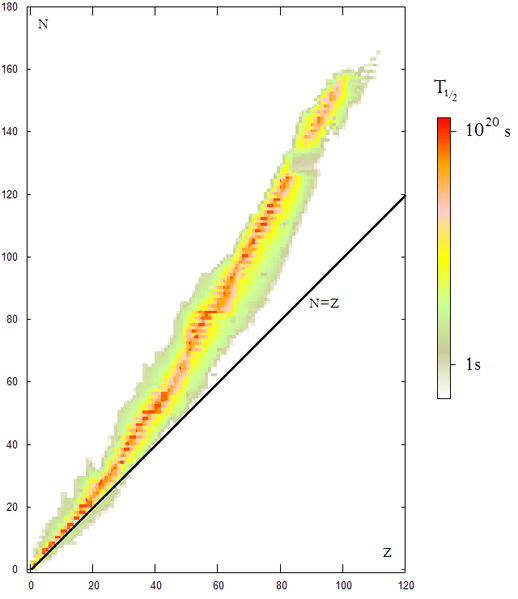
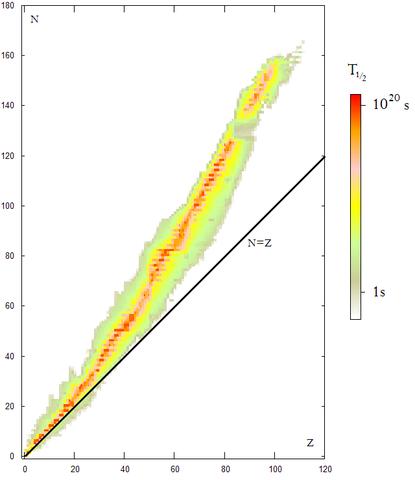
The Nuclear Chart which represent every known nucleus, stable and unstable. Plotted as Z (number of protons) versus N (number of neutrons). The color corresponds to the value of the half-life T½ with a strong log scale, as it varies between and seconds.


 |
This graph image could be recreated using vector graphics as an SVG file. This has several advantages; see Commons:Media for cleanup for more information. If an SVG form of this image is available, please upload it and afterwards replace this template with {{vector version available|new image name}}. |
Licensing[edit]
| I, the copyright holder of this work, release this work into the public domain. This applies worldwide. In some countries this may not be legally possible; if so: I grant anyone the right to use this work for any purpose, without any conditions, unless such conditions are required by law.
|
File history
Click on a date/time to view the file as it appeared at that time.
| Date/Time | Thumbnail | Dimensions | User | Comment | |
|---|---|---|---|---|---|
| current | 20:50, 19 October 2006 | | 640 × 740 (40 KB) | Fffred~commonswiki (talk | contribs) | Graph of the stability of every known nucleus. Plotted as Z (number of protons) versus N (number of neutrons). The color corresponds to the value of the half-life <math>T_{1/2}</math> |
- You cannot overwrite this file.
File usage on Commons
The following page links to this file:
File usage on other wikis
The following other wikis use this file:
- Usage on ast.wikipedia.org
- Usage on br.wikipedia.org
- Usage on ca.wikipedia.org
- Usage on ca.wikibooks.org
- Usage on en.wikibooks.org
- Usage on es.wikipedia.org
- Usage on fr.wikipedia.org
- Usage on fr.wikiversity.org
- Usage on gl.wikipedia.org