File:Sectoral Financial Balances in U.S. Economy.png
Contents
Summary[edit]
| Description |
English: Sectoral Financial Balances in U.S. Economy 1990-2012
|
| Date | |
| Source | I created this file using Federal Reserve data (FRED Database) |
| Author | Farcaster |
 |
This graph image could be recreated using vector graphics as an SVG file. This has several advantages; see Commons:Media for cleanup for more information. If an SVG form of this image is available, please upload it and afterwards replace this template with {{vector version available|new image name}}. |
Other information:
Original upload date (on English Wikipedia): 2013-03-24
Based on article from Martin Wolf, cited below.
Understanding the chart[edit]
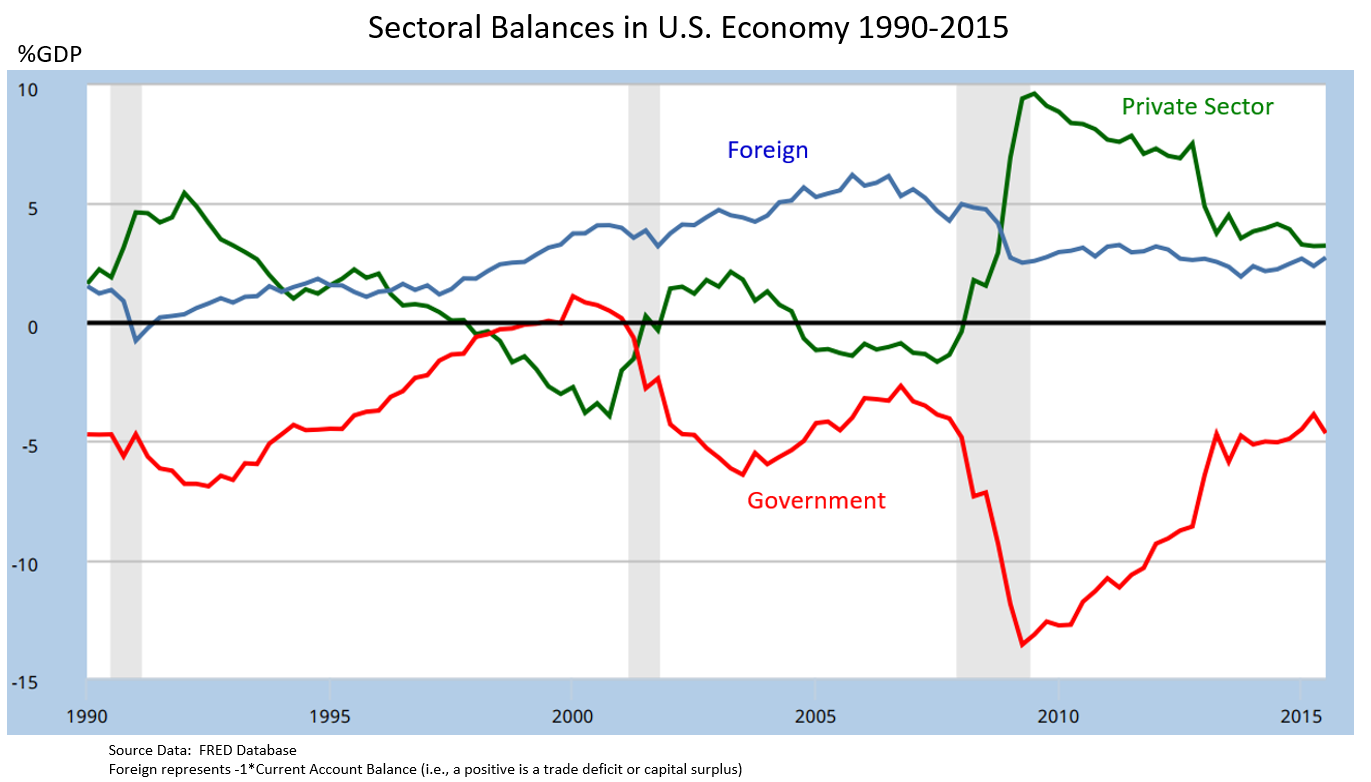
This chart is based on an article and graphic from economist Martin Wolf. Wolf explained in July 2012 that government fiscal balance is one of three major financial sectoral balances in the U.S. economy, the others being the foreign financial sector and the private financial sector. The sum of the surpluses or deficits across these three sectors must be zero by definition. The three data series are:
- Foreign sector financial balance: This is the capital account. A foreign financial surplus or capital account surplus exists because capital is imported (net) to fund the U.S. trade deficit. To finance imports greater than exports, capital must be imported by definition; this is called a surplus.
- Private sector financial balance: This is the difference between private savings (mostly by consumers) and private investment (mostly by businesses). One way to think about an economy is that consumers save and businesses take the savings and invest it. The two figures tend to move in tandem. However, if consumers are saving but businesses are not investing, a surplus develops. In the wake of the subprime mortgage crisis, savings increased but investment declined dramatically, moving this balance from deficit into surplus.
- Government sector financial balance: This is the difference between government revenues less spending. It would be the sum of federal, state and local budget surpluses or deficits.
By definition, with the first two in surplus there must therefore exist a government budget deficit so all three net to zero. For example, the government budget deficit in 2011 was approximately 10% GDP (8.6% GDP of which was federal), offsetting a capital surplus of 4% GDP and a private sector surplus of 6% GDP.[1][2] Wolf argued that the sudden shift in the private sector from deficit to surplus forced the government balance into deficit, writing: "The financial balance of the private sector shifted towards surplus by the almost unbelievable cumulative total of 11.2 per cent of gross domestic product between the third quarter of 2007 and the second quarter of 2009, which was when the financial deficit of US government (federal and state) reached its peak...No fiscal policy changes explain the collapse into massive fiscal deficit between 2007 and 2009, because there was none of any importance. The collapse is explained by the massive shift of the private sector from financial deficit into surplus or, in other words, from boom to bust."[3] Wolf also explained that if the government budget deficit had been forced to zero with the same capital surplus, the private sector income (and thus savings) would have fallen dramatically (likely a Depression) to bring that sector back into deficit, such that all three sectors would net to zero: "There is absolutely no doubt what would have happened if the government had been unwilling to borrow when borrowing by the private sector collapsed: we would have seen a huge depression. Fortunately, that did not happen. Government borrowed. Of course, that did not fully offset the collapse in private borrowing. But it helped."[4] An up-to-date version of the chart (directionally correct but not exactly) can be viewed here: FRED Database-Chart of Financial Sector Balances
As a formula[edit]
The above expressed as an equation or mathematical identity: C+G+T = 0.
- C: Private sector financial balance (+ for private sector surplus, where savings is greater than investment, - for private sector deficit, where savings is less than investment)
- G: Government sector financial balance (+ for budget surplus, - for budget deficit)
- T: Foreign sector financial balance (+ for capital surplus or trade deficit, - for capital deficit or trade surplus)
Note that if you define the foreign sector balance instead as the current account balance (i.e., trade deficit is a - and trade surplus is a +), the formula becomes C+G-T=0.[5]
The graphic can also be describing using the Keynesian equilibrium formula, where injections equals withdrawals:
- Investment + Government + Exports = Savings + Taxes + Imports
- I + G + X = S + T + M
Rearranging using algebra to show the data series in the graphic:
- (G-T) + (X-M) = (S-I)
- 0 = (S-I) + (T-G) - (X-M)
- S-I is the private sector balance, a positive amount as savings has exceeded investment since 2009.
- T-G is the government sector balance, a negative number as the government has run deficits from 2002-2015.
- X-M is the foreign sector, a negative number (trade deficit or capital surplus). Since the formula is subtracting this amount, we graph the inverse (*-1) so it appears as a positive number in the graph.
Note that this equation holds at economic equilibrium only, but is useful for illustrating the concepts.
Creating the chart[edit]
The chart can be created using the following Federal reserve database (FRED) series, with conversions to %GDP and to scale:
- Capital surplus as % GDP: -1*NETFI /GDP * 100
- Private sector balance as % GDP: ((GPSAVE-GPDI)/GDP) * 100
- Net lending or borowing as % GDP: AD01RC1Q027SBEA / GDP * 100
While the numbers are not exact, they directionally accurate. Here is a link to a chart with current information: FRED Chart as % GDP
Understanding the private sector financial balance[edit]
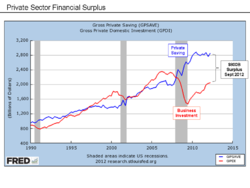
Economist Paul Krugman also explained in December 2011 the causes of the sizable shift from private sector deficit to surplus in the U.S.: "This huge move into surplus reflects the end of the housing bubble, a sharp rise in household saving, and a slump in business investment due to lack of customers."[6] The private sector financial balance is the net of the savings and investment lines shown in the "Private Sector Financial Surplus" chart at right. In other words, if you graphed the expression "Private savings - Business investment" as one line and as a % GDP, you would get in the blue line in the "Sectoral Financial Balances in the U.S. Economy" chart.
References[edit]
- ↑ Financial Times-Martin Wolf-The Balance Sheet Recession in the U.S.- July 2012
- ↑ Martin Wolf-Financial Times-We Still Have that Sinking Feeling-July 2012
- ↑ Financial Times-Martin Wolf-The Balance Sheet Recession in the U.S.- July 2012
- ↑ Financial Times-Martin Wolf-Debt, Deleveraging and Crisis in the U.S. - July 12, 2012
- ↑ QFinance-Anthony Harrington-Mauldin’s "Endgame" teaches politicians the basics, but are they listening-March 2011
- ↑ NYT-Paul Krugman-The Problem-December 2011
Licensing[edit]
|
User:Farcaster, the copyright holder of this work, hereby publishes it under the following licenses:
You may select the license of your choice.
|

Original upload log[edit]
Transferred from en.wikipedia to Commons by NUMB3RN7NE using CommonsHelper. The original description page was here. All following user names refer to en.wikipedia.
| Date/Time | Dimensions | User | Comment |
|---|---|---|---|
| 05:25, 24 March 2013 | 960 × 720 (50,044 bytes) | w:en:Farcaster (talk | contribs) | Uploading a self-made file using [[Wikipedia:File_Upload_Wizard|File Upload Wizard]] |
![]() The categories of this image should be checked. Check them now!
The categories of this image should be checked. Check them now!
- Remove redundant categories and try to put this image in the most specific category/categories
- Remove this template by clicking here (or on the first line)
File history
Click on a date/time to view the file as it appeared at that time.
| Date/Time | Thumbnail | Dimensions | User | Comment | |
|---|---|---|---|---|---|
| current | 03:58, 7 December 2015 | | 1,371 × 782 (163 KB) | Farcaster (talk | contribs) | Reverted to version as of 23:06, 5 December 2015 (UTC) |
| 03:58, 7 December 2015 |  | 1,371 × 782 (163 KB) | Farcaster (talk | contribs) | Reverted to version as of 23:06, 5 December 2015 (UTC) | |
| 21:48, 6 December 2015 |  | 1,371 × 782 (163 KB) | Farcaster (talk | contribs) | Reverted to version as of 23:05, 5 December 2015 (UTC) | |
| 23:06, 5 December 2015 |  | 1,371 × 782 (163 KB) | Farcaster (talk | contribs) | Reverted to version as of 23:05, 5 December 2015 (UTC) | |
| 23:05, 5 December 2015 |  | 2,520 × 1,512 (257 KB) | Farcaster (talk | contribs) | Reverted to version as of 04:53, 5 December 2015 (UTC) | |
| 23:05, 5 December 2015 |  | 1,371 × 782 (163 KB) | Farcaster (talk | contribs) | Updated chart | |
| 04:53, 5 December 2015 | 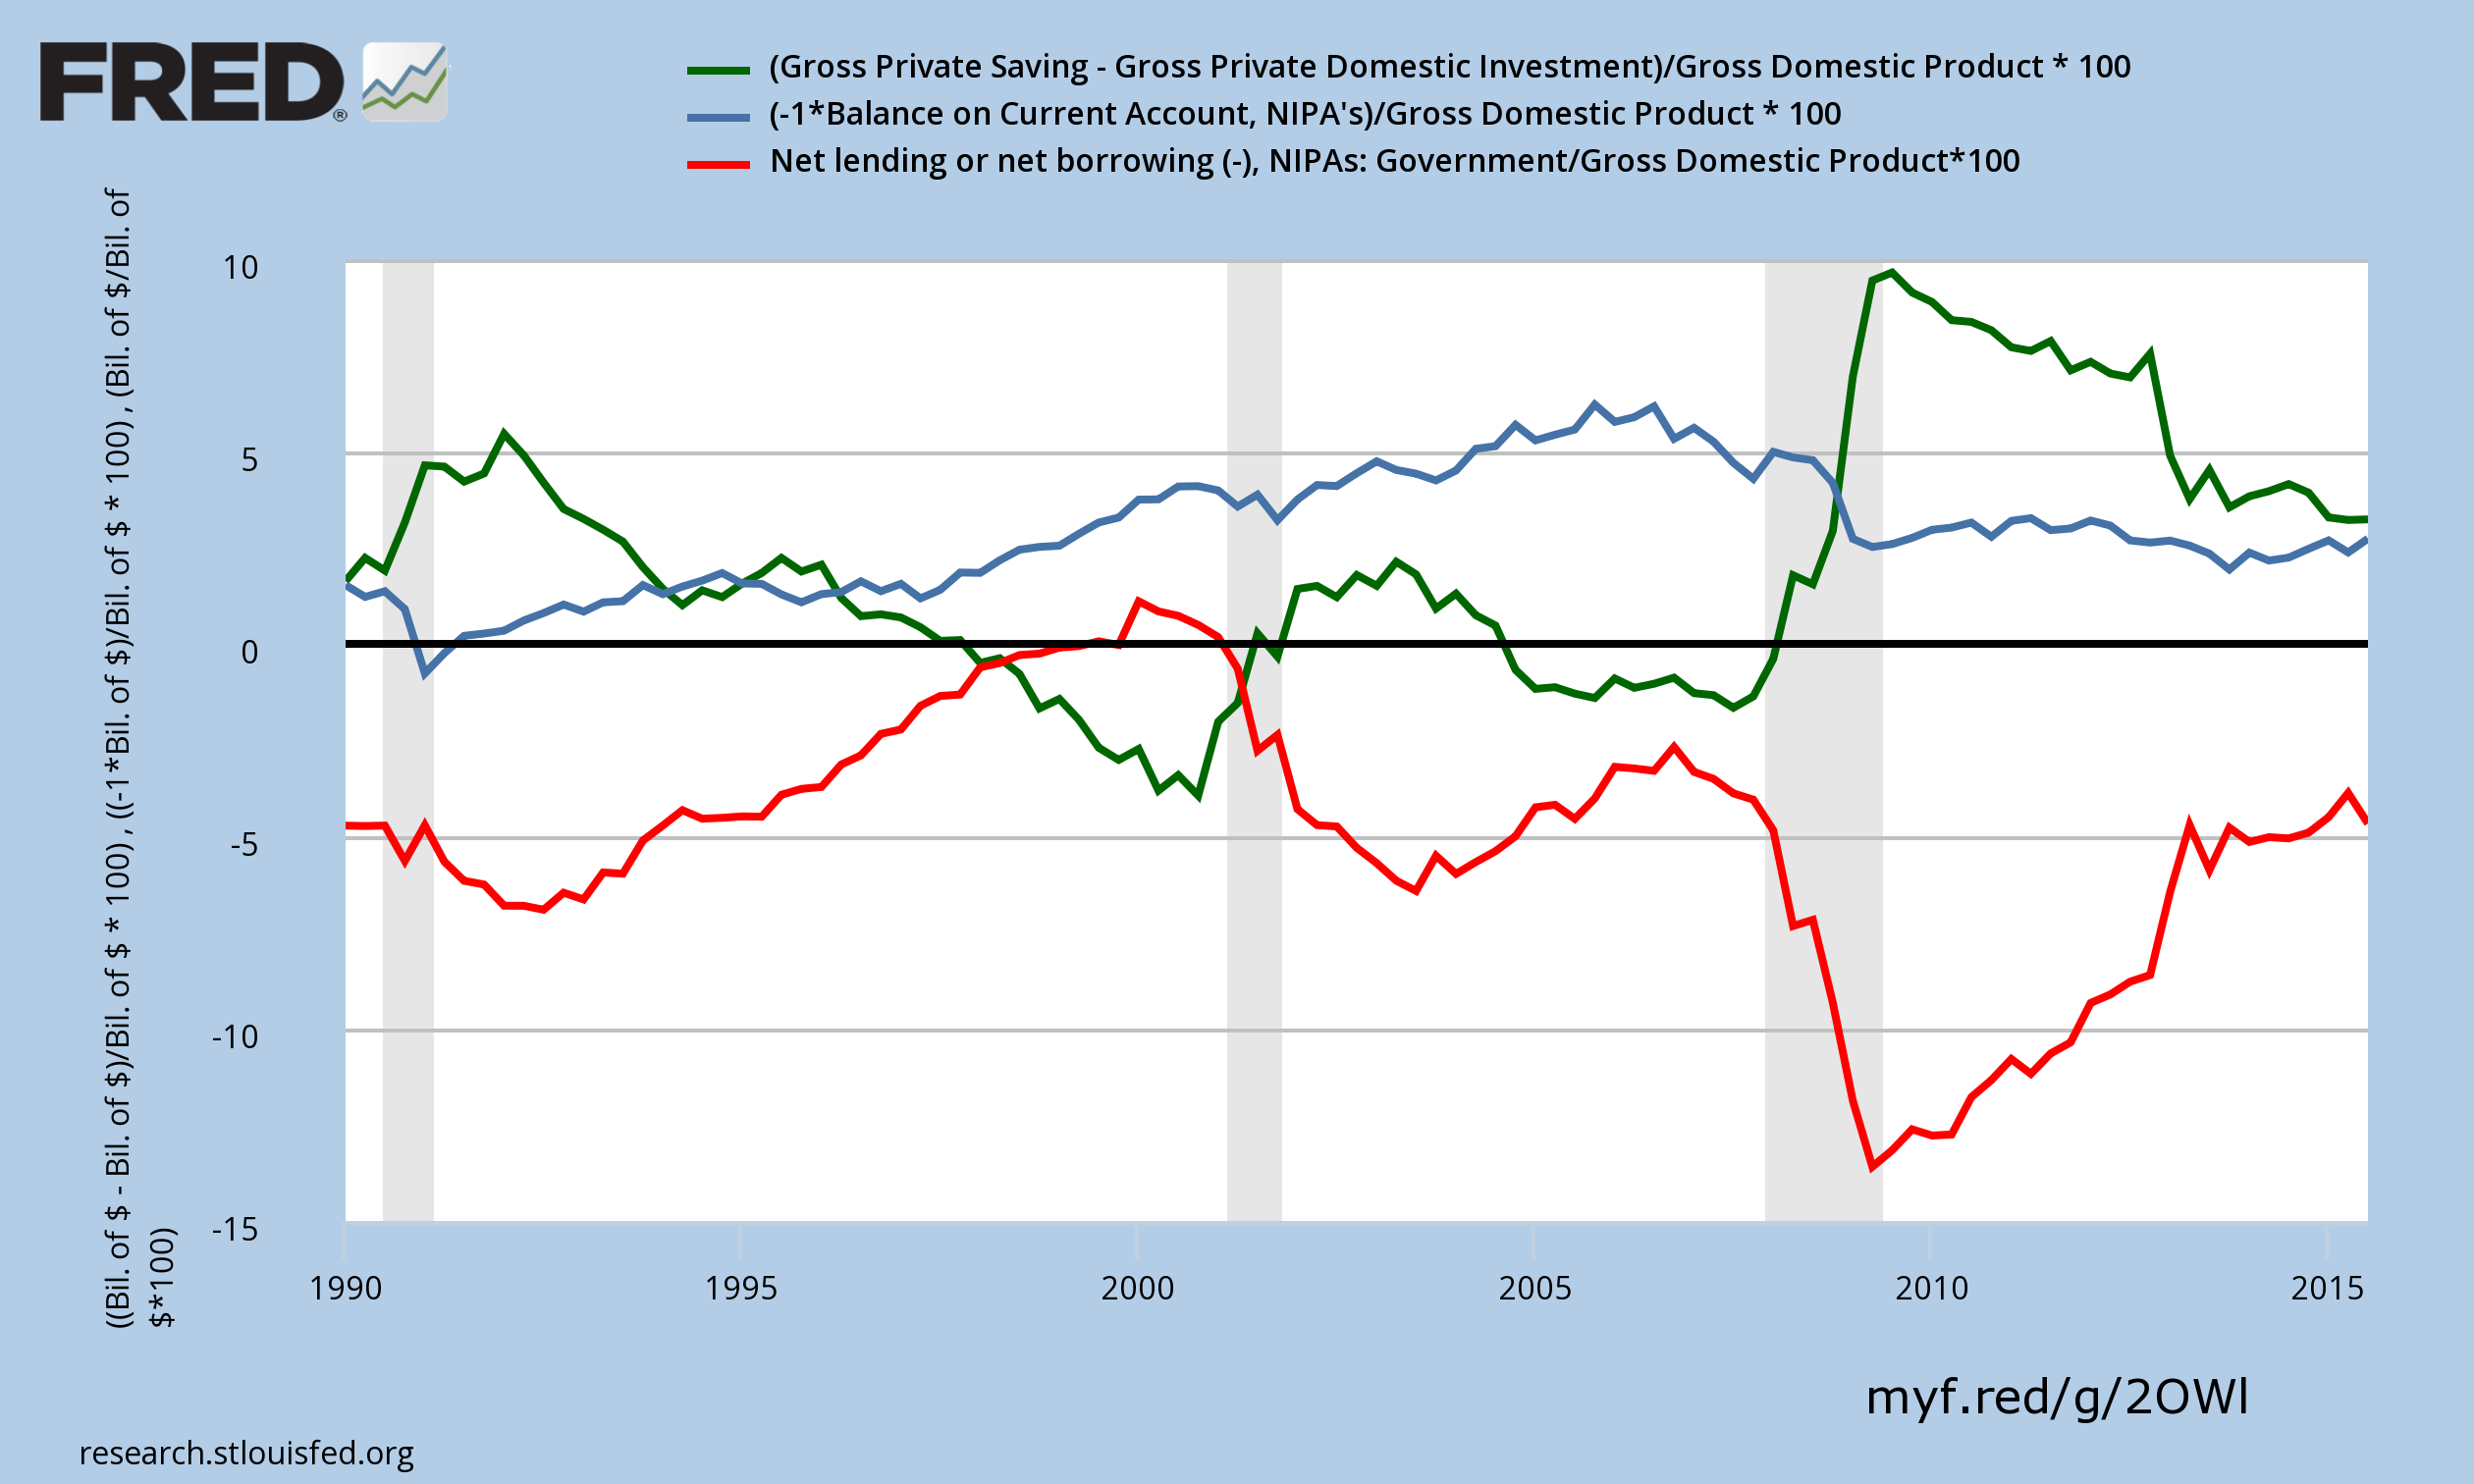 | 2,520 × 1,512 (257 KB) | Farcaster (talk | contribs) | Update through 2015 | |
| 19:01, 4 December 2015 | 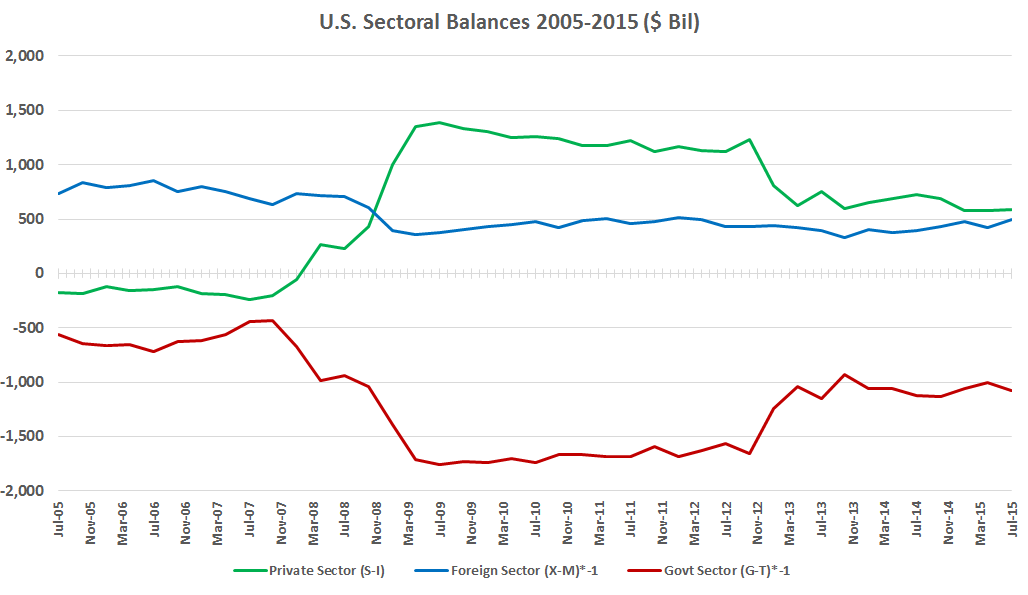 | 1,028 × 595 (26 KB) | Farcaster (talk | contribs) | Update chart for 2015 | |
| 13:00, 2 March 2014 | 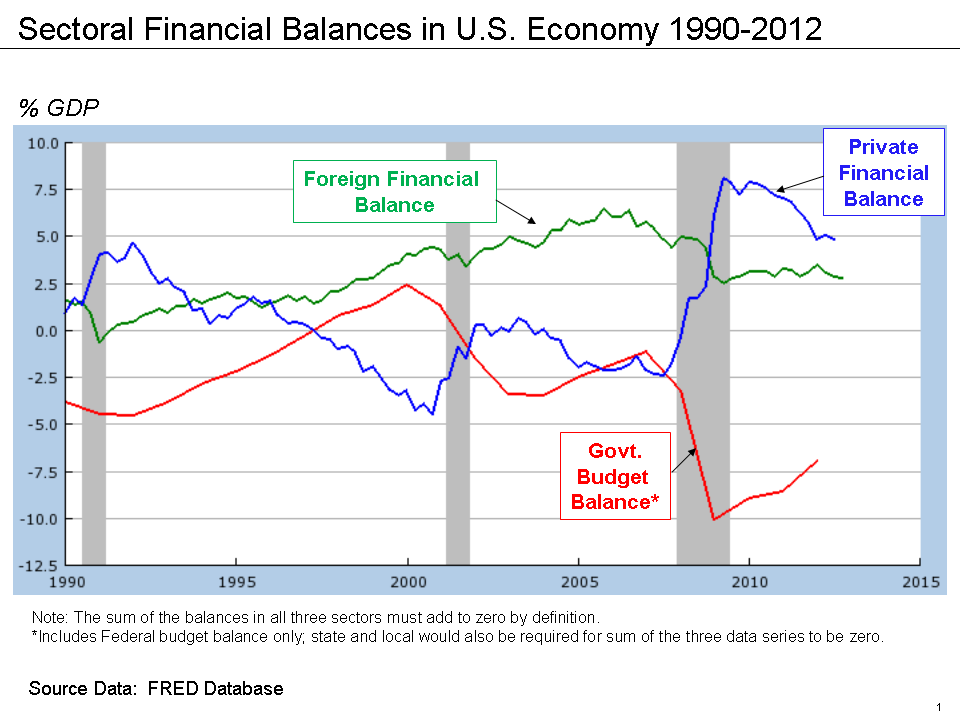 | 960 × 720 (49 KB) | File Upload Bot (Magnus Manske) (talk | contribs) | Transfered from en.wikipedia by User:NUMB3RN7NE using CommonsHelper |
- You cannot overwrite this file.
File usage on Commons
The following 6 pages link to this file:
- Top 200 graph images that should use vector graphics
- User:OgreBot/Uploads by new users/2015 December 04 18:00
- User:OgreBot/Uploads by new users/2015 December 05 03:00
- User:OgreBot/Uploads by new users/2015 December 05 21:00
- User:OgreBot/Uploads by new users/2015 December 06 21:00
- User:OgreBot/Uploads by new users/2015 December 07 03:00
File usage on other wikis
The following other wikis use this file:
- Usage on de.wikipedia.org
- Usage on en.wikipedia.org
- Usage on zh.wikipedia.org