File:Supply-demand-P.png
From Wikimedia Commons, the free media repository
No higher resolution available.
Supply-demand-P.png (617 × 557 pixels, file size: 7 KB, MIME type: image/png)
 |
This graph image could be recreated using vector graphics as an SVG file. This has several advantages; see Commons:Media for cleanup for more information. If an SVG form of this image is available, please upload it and afterwards replace this template with {{vector version available|new image name}}. |
Image information[edit]
| Description |
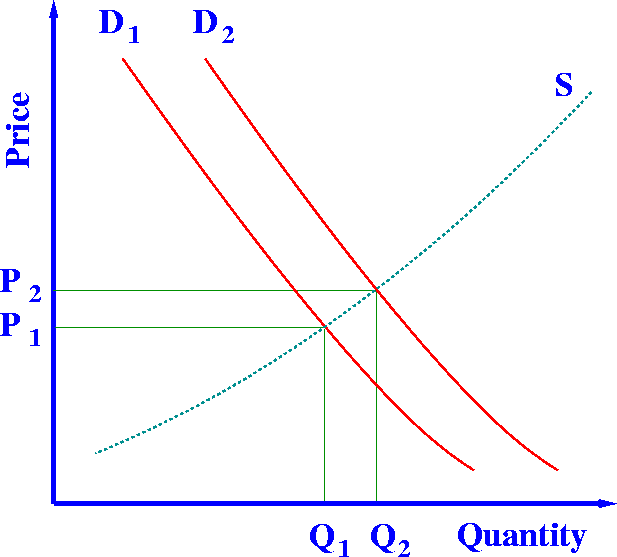
Afrikaans: Die vraag en aanbod model beskryf hoe pryse varieer as gevolg van die balans tussen produk beskikbaarheid en die vraag daarna. Die grafiek beeld 'n toename in vraag vanaf D1 tot D2 met die gevolglike toename in prys en hoeveelheid benodig om 'n nuwe ewewigspunt op die aanbodkurwe (S) te bereik.
English: This supply and demand model shows how prices vary because of a balance between the availability of a product and the demand for it. The graph shows an increase in demand from D1 to D2 with the resulting increase in price and the amount needed to reach a new balance point on the supply curve (S).
|
| Date | (original upload date) |
| Source | Transferred from en.wikipedia to Commons. |
| Author | CSTAR Later versions were uploaded by Guanaco, Everlong at en.wikipedia. |
Licensing[edit]
 |
Permission is granted to copy, distribute and/or modify this document under the terms of the GNU Free Documentation License, Version 1.2 or any later version published by the Free Software Foundation; with no Invariant Sections, no Front-Cover Texts, and no Back-Cover Texts. A copy of the license is included in the section entitled GNU Free Documentation License. Subject to disclaimers. |
| This file is licensed under the Creative Commons Attribution-Share Alike 3.0 Unported license. Subject to disclaimers. | ||
|
||
| This licensing tag was added to this file as part of the GFDL licensing update.
|
Original upload log[edit]
The original description page was here. All following user names refer to en.wikipedia.
- 2004-12-15 21:51 Everlong 617×557×8 (6909 bytes) Reverted to earlier revision
- 2004-12-15 21:50 Everlong 621×562×8 (8436 bytes) Reverted to earlier revision
- 2004-08-03 21:13 Guanaco 617×557×8 (6909 bytes) I hate IE...
- 2004-08-03 18:44 Guanaco 617×557×4 (4681 bytes) transparency, optimize
- 2004-07-22 00:05 CSTAR 621×562×8 (8436 bytes) {{GFDL}}
File history
Click on a date/time to view the file as it appeared at that time.
| Date/Time | Thumbnail | Dimensions | User | Comment | |
|---|---|---|---|---|---|
| current | 12:46, 8 August 2007 | | 617 × 557 (7 KB) | Anrie (talk | contribs) | ==Image information== {{Information |Description={{af|Die vraag en aanbod model beskryf hoe pryse varieer as gevolg van die balans tussen produk beskikbaarheid en die vraag daarna. Die grafiek beeld 'n toename in vraag vanaf D1 tot D2 met die gevolglike t |
- You cannot overwrite this file.
File usage on Commons
The following 2 pages link to this file:
File usage on other wikis
The following other wikis use this file:
- Usage on af.wikipedia.org
- Usage on beta.wikiversity.org
- Usage on en.wikipedia.org
- History of science
- Talk:Economics/Archive 1
- Wikipedia:Today's featured article/August 3, 2004
- Wikipedia:Today's featured article/August 2004
- Wikipedia:Today's featured article/December 2004
- Wikipedia:Today's featured article/December 15, 2004
- User:Jersey Devil
- User:DennyCrane
- User:DennyCrane/Userbox Economics
- User:Crocodile Punter/Userboxes/Econ Degree
- User:Tacmasi
- Usage on eo.wikipedia.org
- Usage on id.wikipedia.org
- Usage on ka.wikipedia.org
- Usage on kn.wikipedia.org
- Usage on no.wikipedia.org
- Usage on ru.wikipedia.org
- Usage on su.wikipedia.org
- Usage on th.wikipedia.org
- ผู้ใช้:Pruetboonma
- แม่แบบ:User เศรษฐศาสตร์
- ผู้ใช้:Beamking
- ผู้ใช้:ปท.ไทย
- ผู้ใช้:บริพัตร์
- ผู้ใช้:Atividia
- ผู้ใช้:Iamion
- ผู้ใช้:ELUNIUMMAN
- ผู้ใช้:Bozzini
- ผู้ใช้:Banlu Kemiyatorn
- ผู้ใช้:Kankawee
- ผู้ใช้:Kubpum~thwiki
- ผู้ใช้:PaaTop
- ผู้ใช้:Jaiyen29
- ผู้ใช้:Watanyu
- วิกิพีเดีย:กล่องผู้ใช้/การศึกษา
- ผู้ใช้:Venezier
- ผู้ใช้:Thewhitechess
- ผู้ใช้:Golbun Nakwat
- ผู้ใช้:Nakwat
- Usage on zh-classical.wikipedia.org
- Usage on zh.wikipedia.org